AI stocks in a bubble? Not all of them.
Finding investment opportunities in the AI sector | Part 1

Summary
Investors love to debate whether AI stocks are in a bubble. To make up our mind, we mapped 77 companies across the AI industry, and the picture is mixed. Two-thirds of them look overpriced right now, but if we factor in projected revenue growth, everything flips: suddenly, two-thirds look underpriced, and some really interesting opportunities pop up. Let’s dig in.
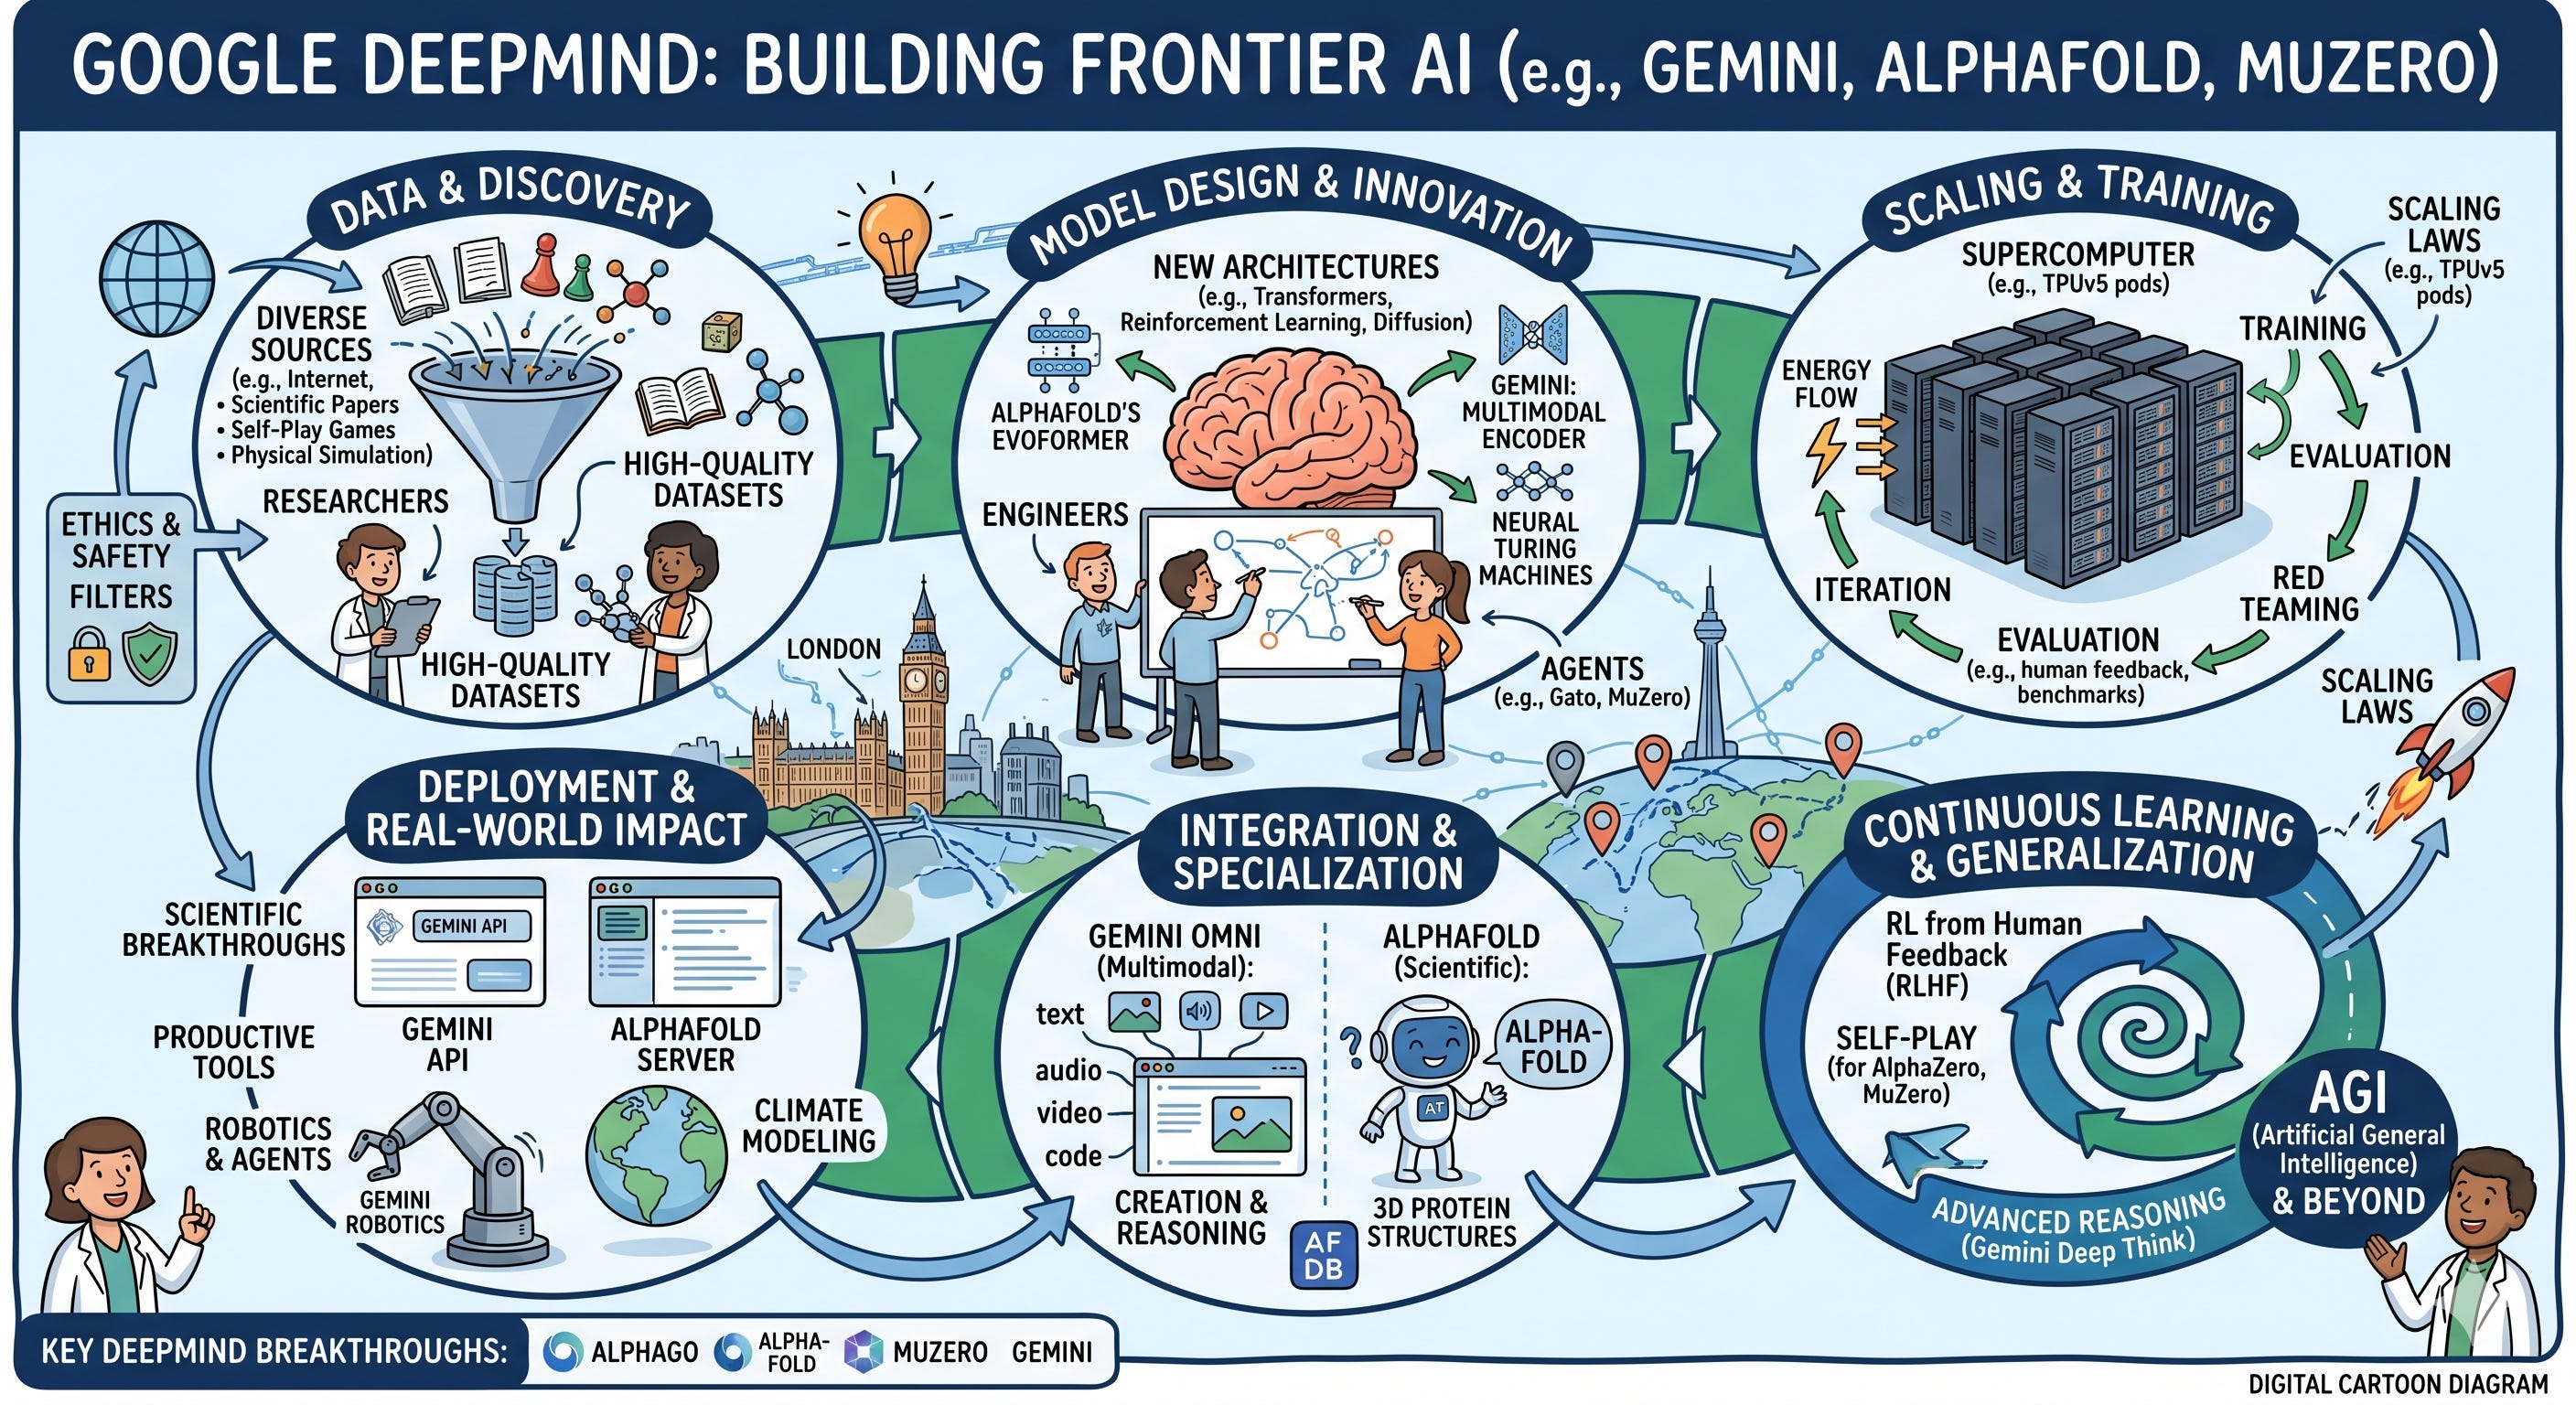
AI industry map: from atoms to bits and back
First, let's unpack the AI industry. Here is how value moves within the AI stack - from raw materials and energy all the way down to AI-powered applications. But while end-customer value flows from atoms to bits, shareholder value flows in the opposite direction (along with revenue and profits). The diagram arrow shows the latter.

We break the industry down into three main layers: Physical upstream, Software & models, and Downstream apps. We borrowed this upstream-downstream logic from the oil and mining industries. Let's zoom into each.
LAYER 1: The physical upstream is where AI models (and many apps) live in the physical world - and how they get their power. It breaks down into:
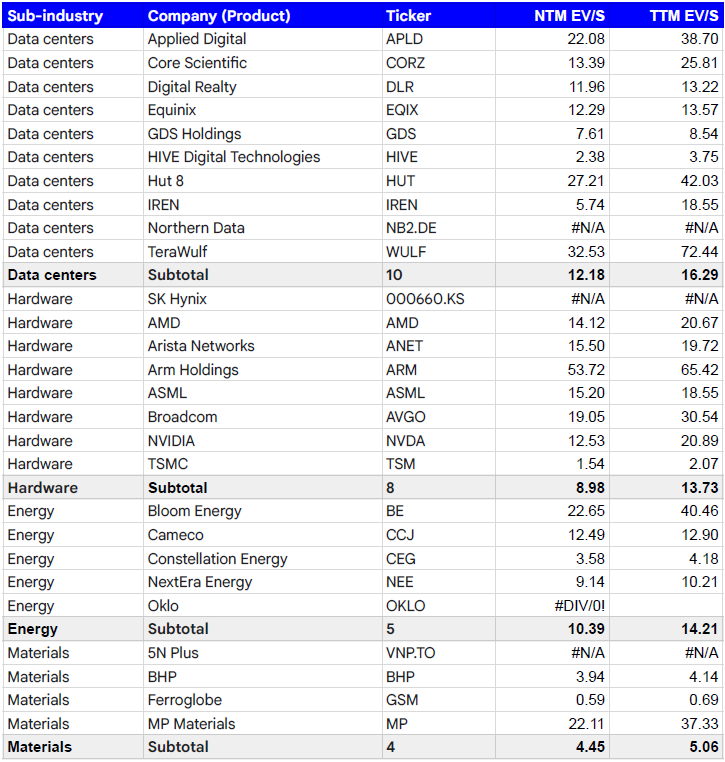
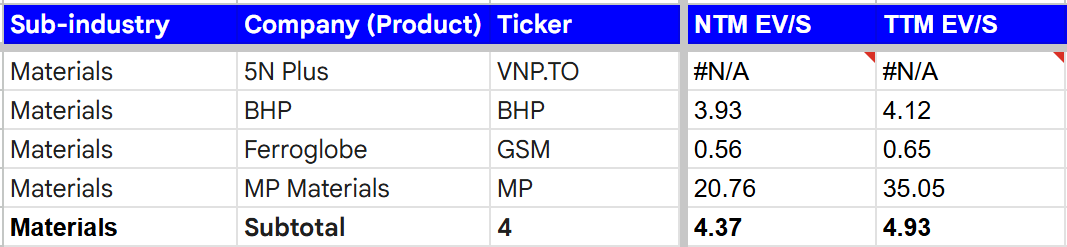
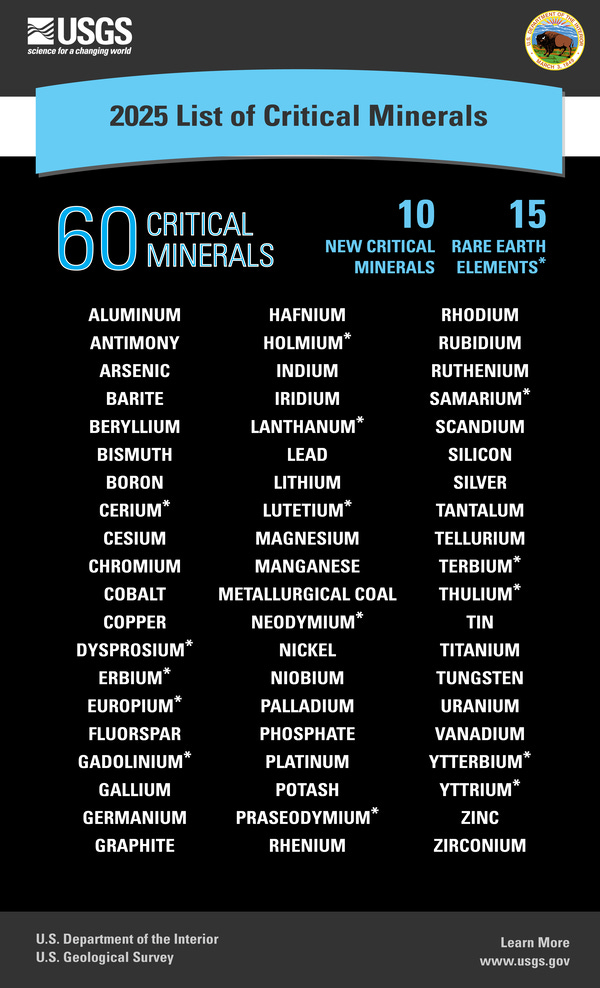
Materials. The raw resources used to build computer chips, servers, switches, cables, and cooling systems. The US Department of the Interior publishes a comprehensive list of these minerals to spark debate about how to fix supply chain risks. Here are the tickers we track (with more coming soon):
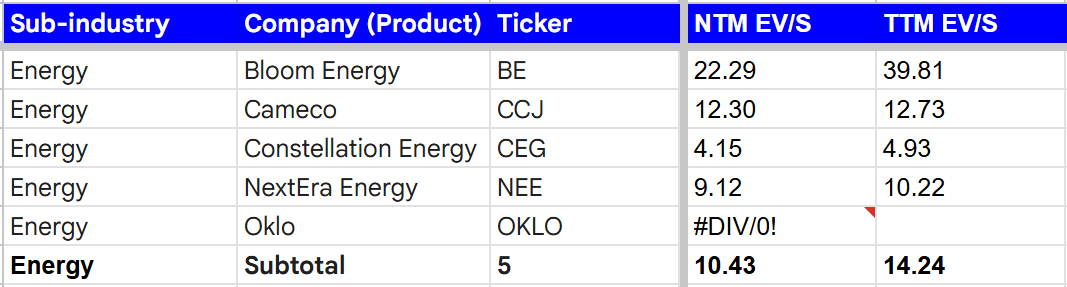
Energy. Data centers need cheap, reliable, and ideally clean power. Tickers:
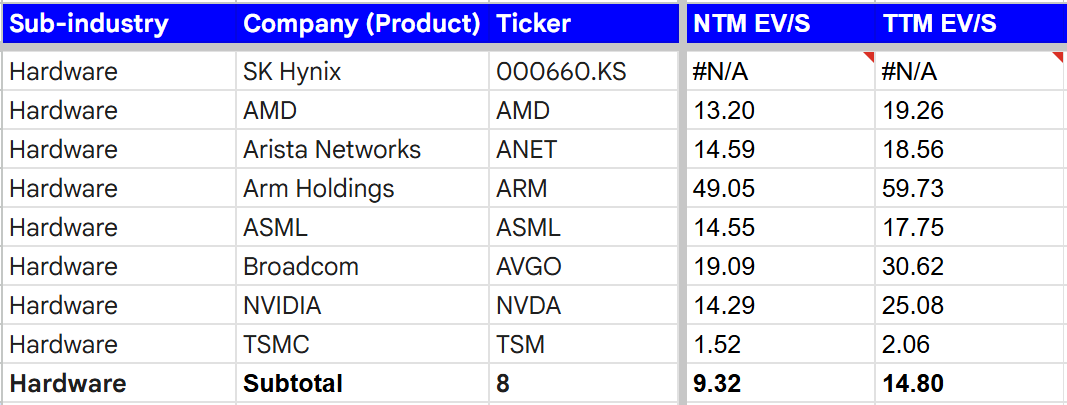
Hardware. The AI economy runs on fast chips, and it needs lithography equipment to build them. Two giants hold near-monopolies here: ASML (for lithography machines) and Nvidia (for GPUs). Tickers:
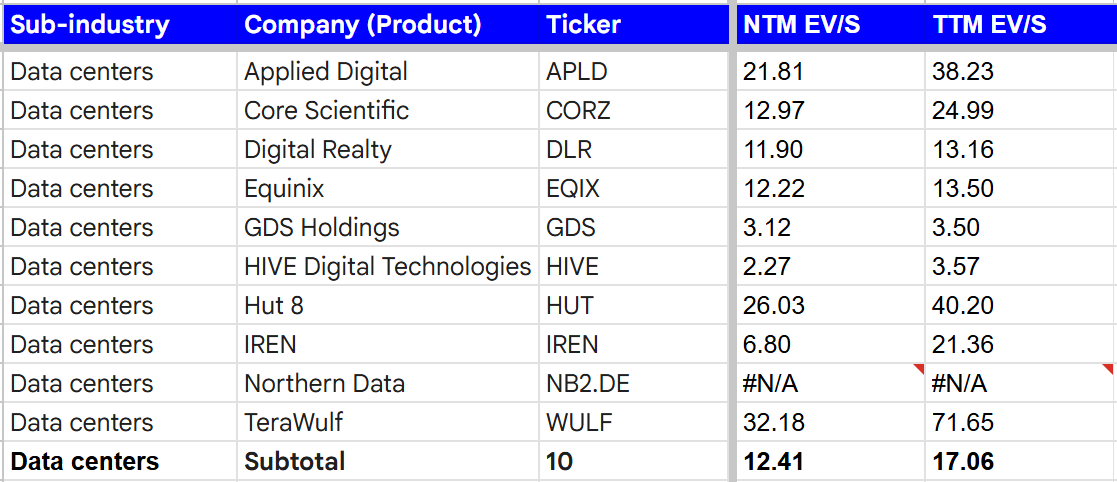
Data centers. This is where the actual computing power lives - the most critical resource for companies building AI models. While data centers rely on lots of software, this subgroup focuses strictly on hardware infrastructure. Tickers:
LAYER 2: Software & models is the absolute core of the industry. Breakthroughs in model architecture are what triggered the current AI boom, supported by specialized software for compute cluster management and chip design. This layer includes:
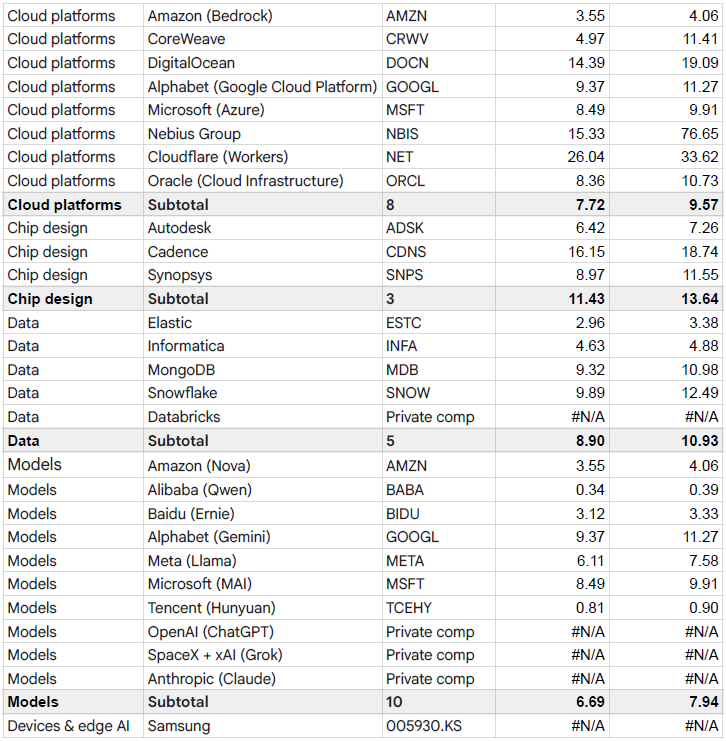
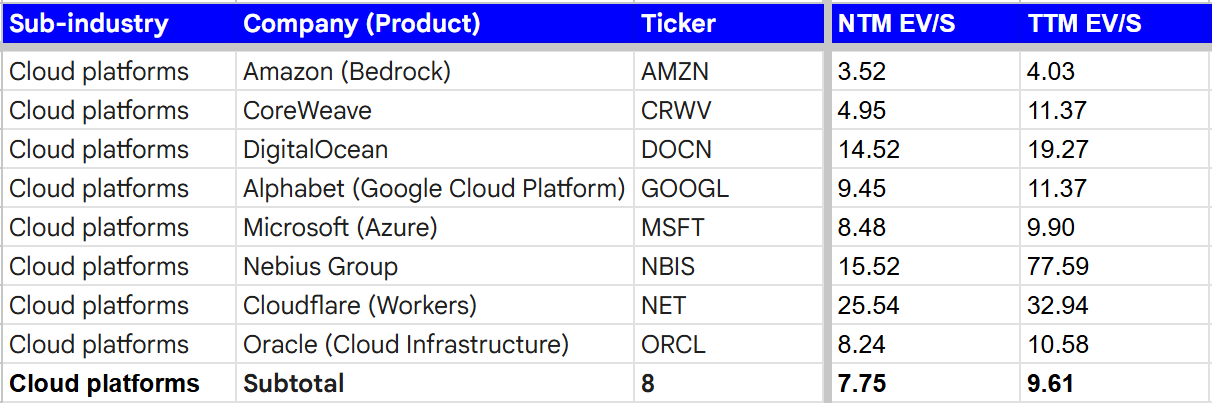
Cloud platforms. To run AI models, you need a highly specialized software stack sitting on top of data center hardware. Since most data center operators don't want to build this software layer themselves, specialized AI clouds step in - and many end up building their own infrastructure too. Tickers:
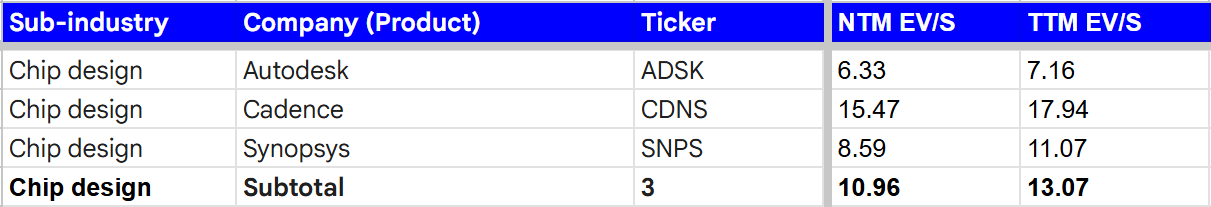
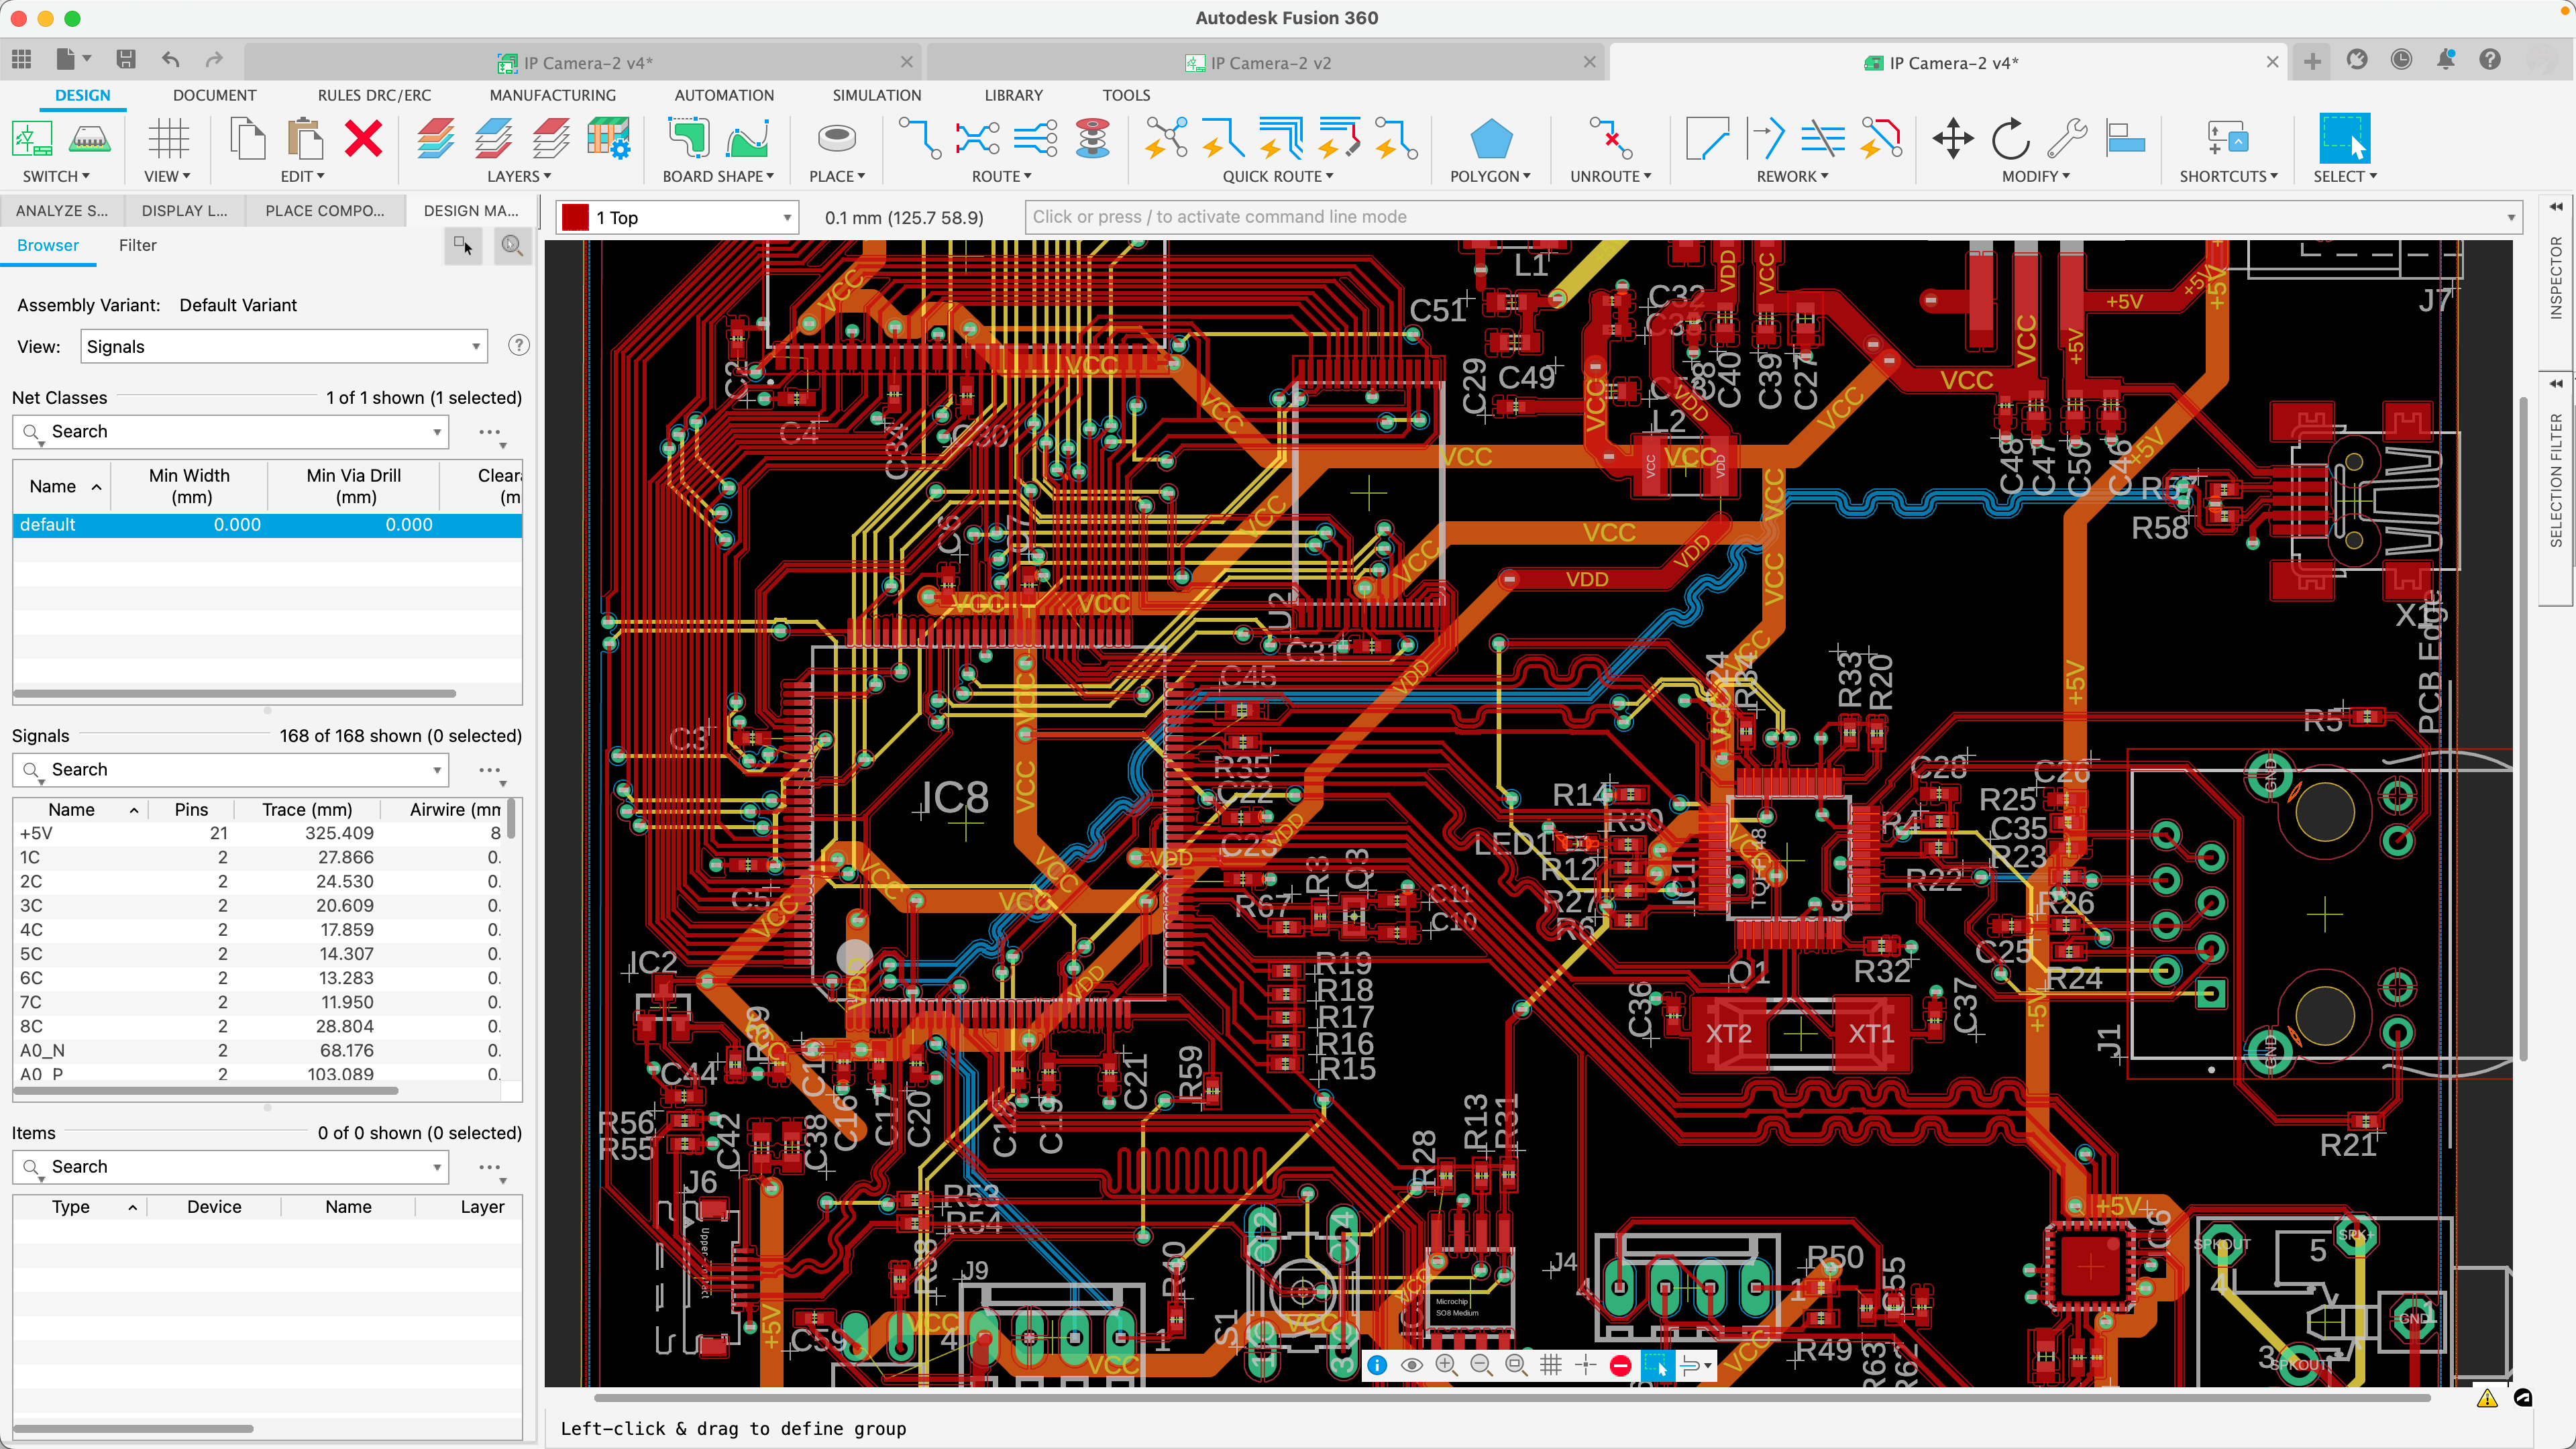
Chip design. Electronic Design Automation (EDA) tools: a small but stand-alone software subgroup. Tickers:
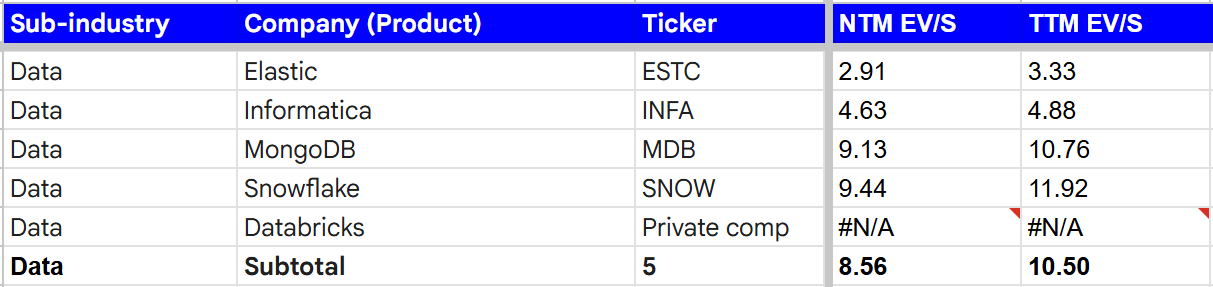
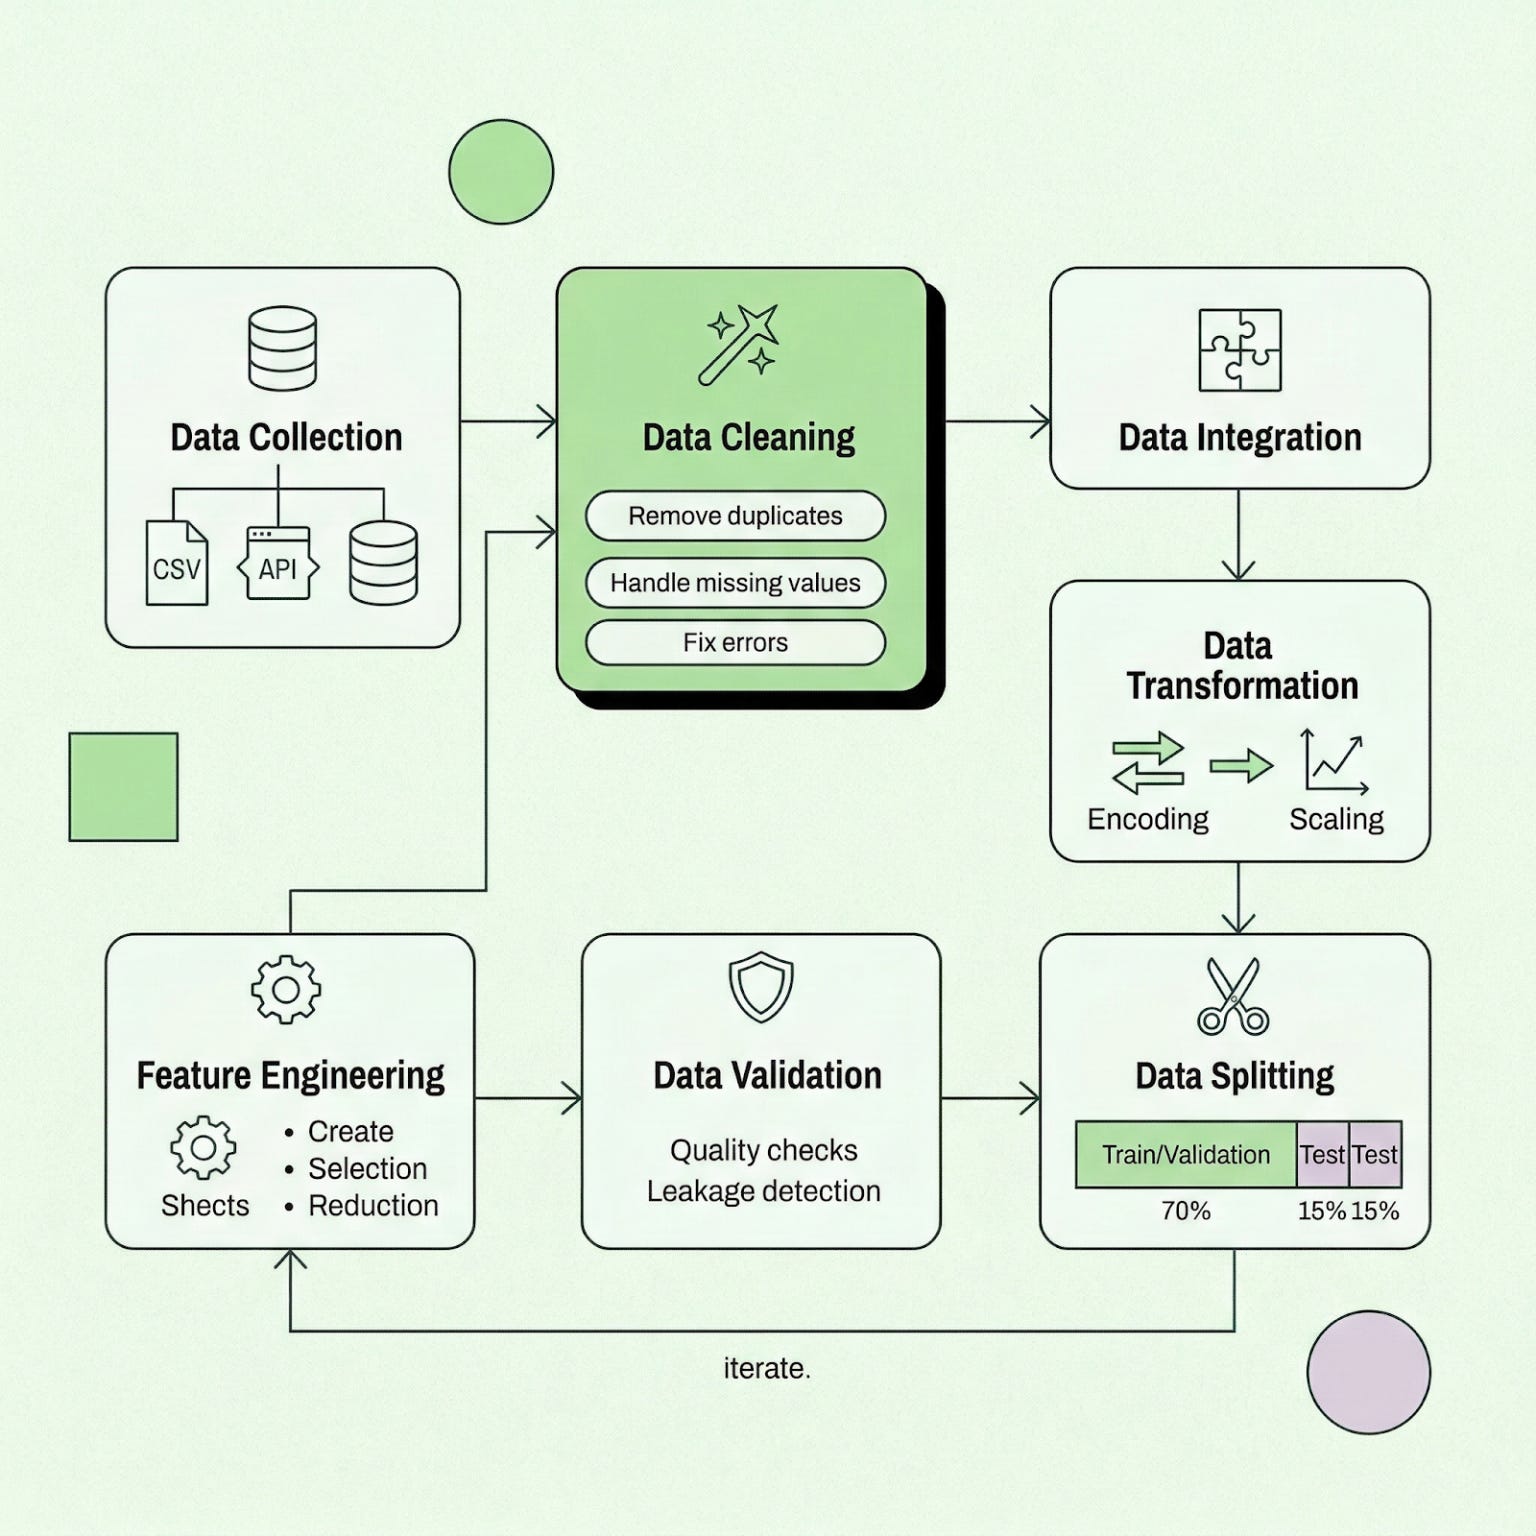
Data. This is the thinnest layer in the stack, but managing data workflows for AI is still a real, stand-alone software business. Tickers:
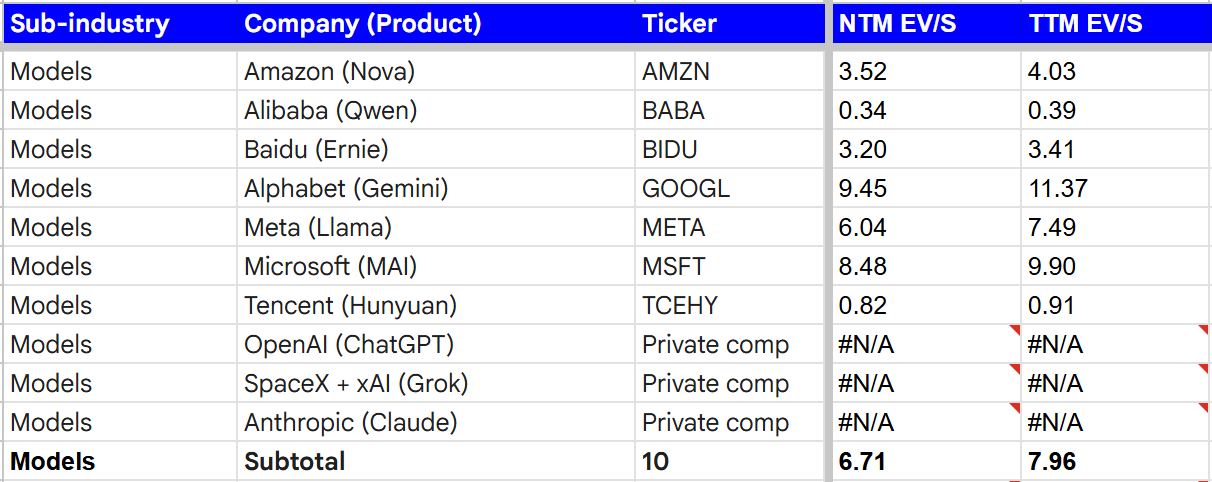
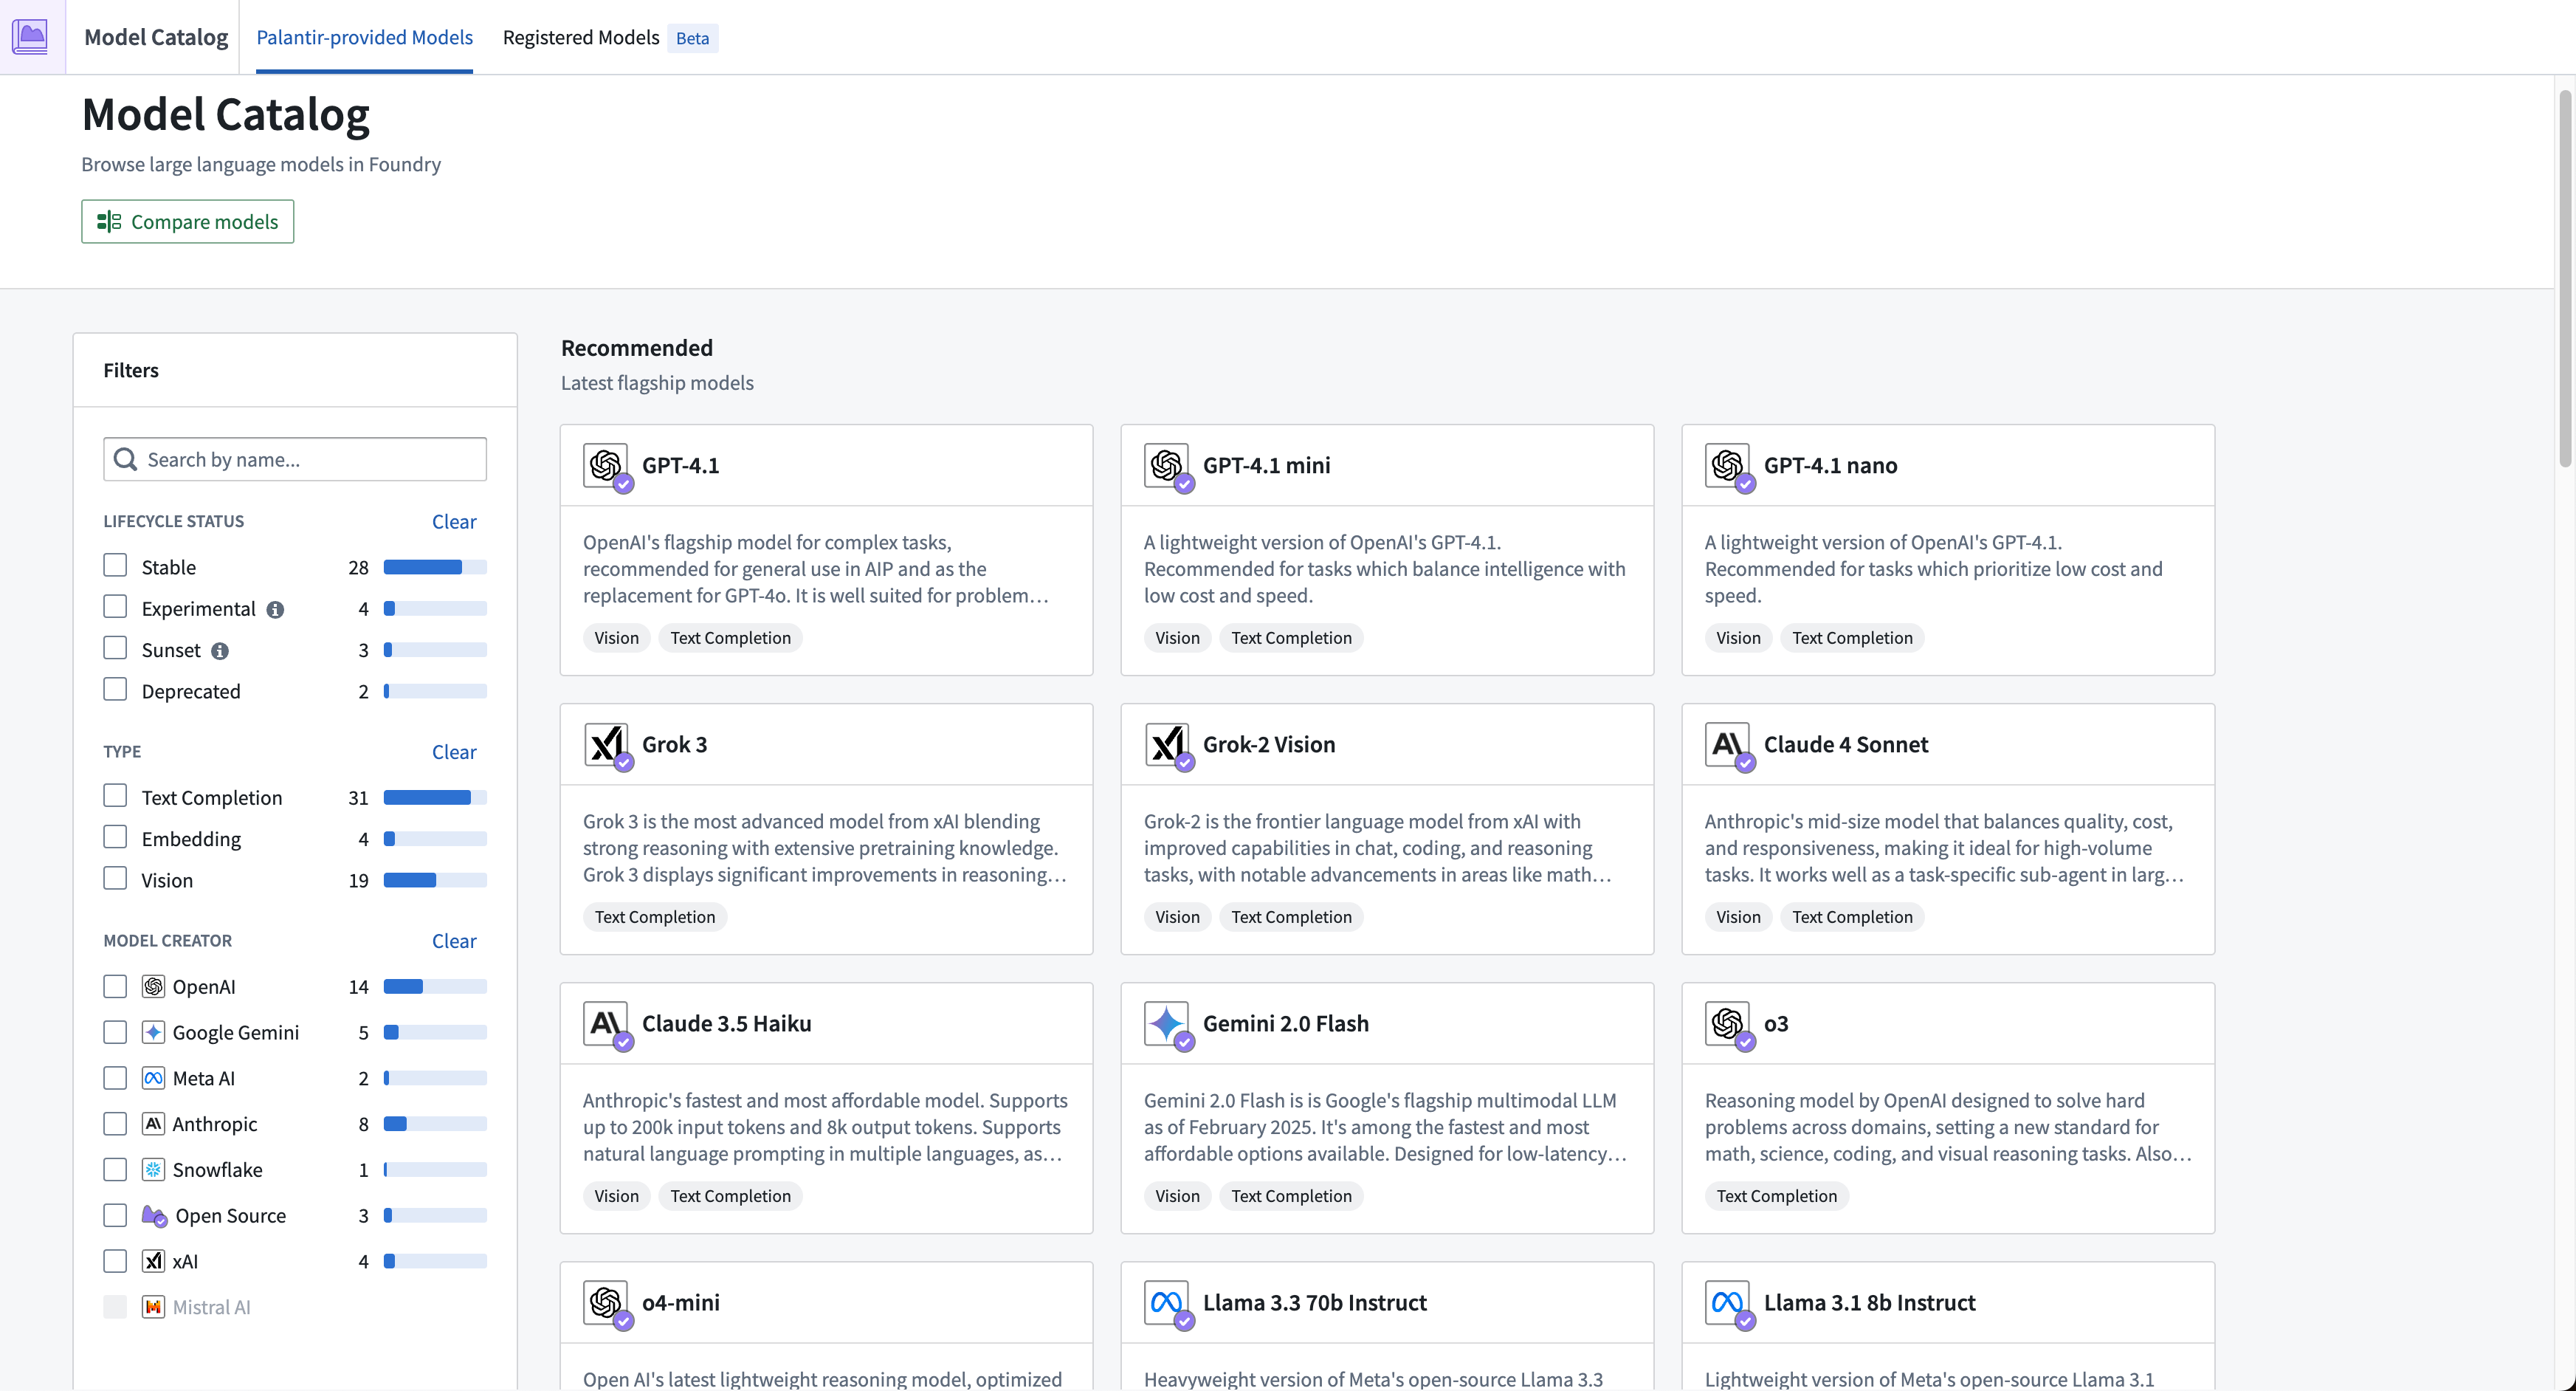
Models. This is the brain of AI, and it’s a pure battlefield. It’s where the world's top talent and massive capital are being poured. Most frontier companies here are still private, though secondary market valuations for Anthropic and OpenAI are already closing in on $1 trillion. Tickers:
LAYER 3: Downstream apps is the user-facing layer driving mass adoption. It includes:
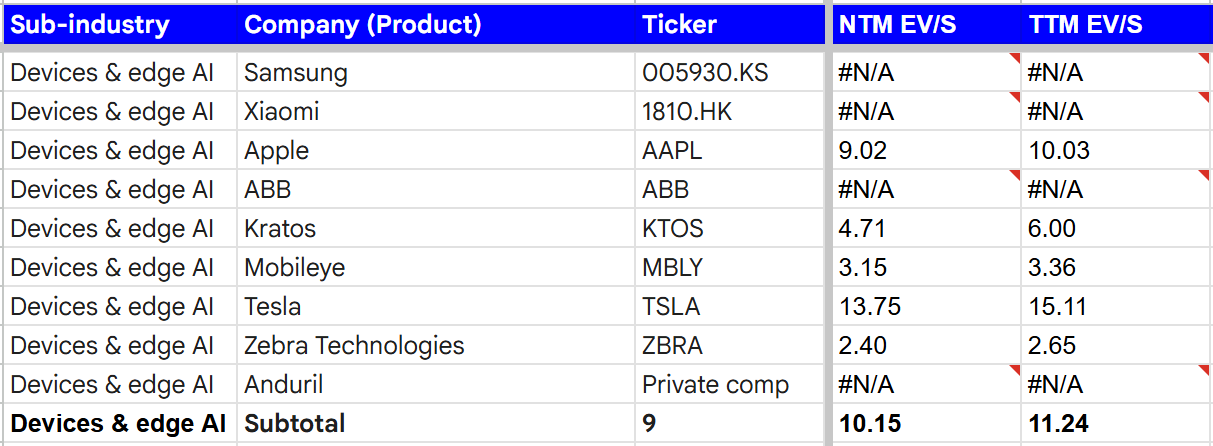
Smart devices & edge AI. This is where robots, cars, and gadgets get an AI brain. Many legacy hardware giants are adding customer-facing AI to their tech, which puts them straight into this category. Tickers:
Consumer & prosumer AI apps. Chatbots, image generators, and software tools are exploding in popularity simply because the underlying models have gotten good. Tickers:
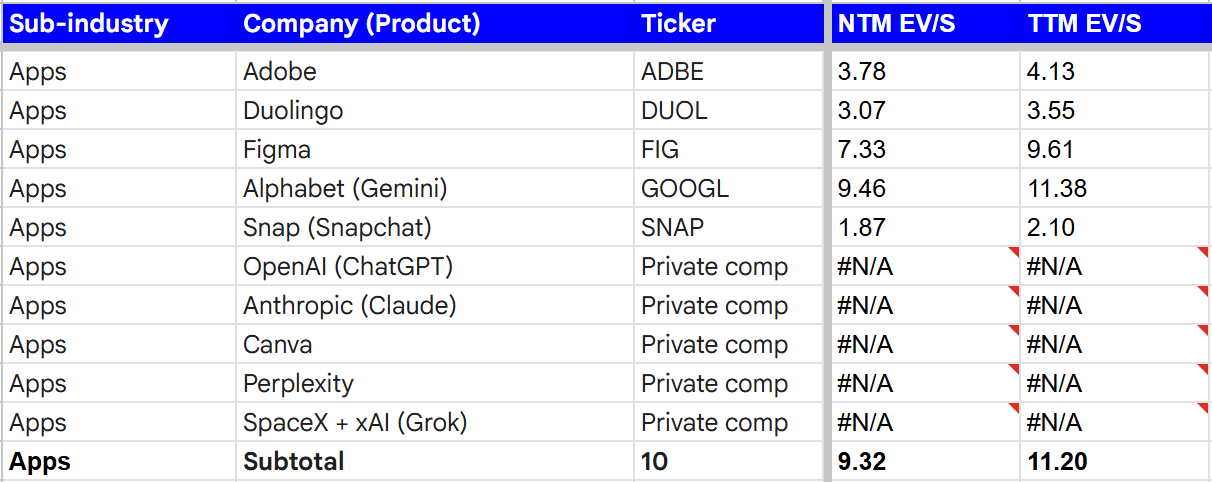
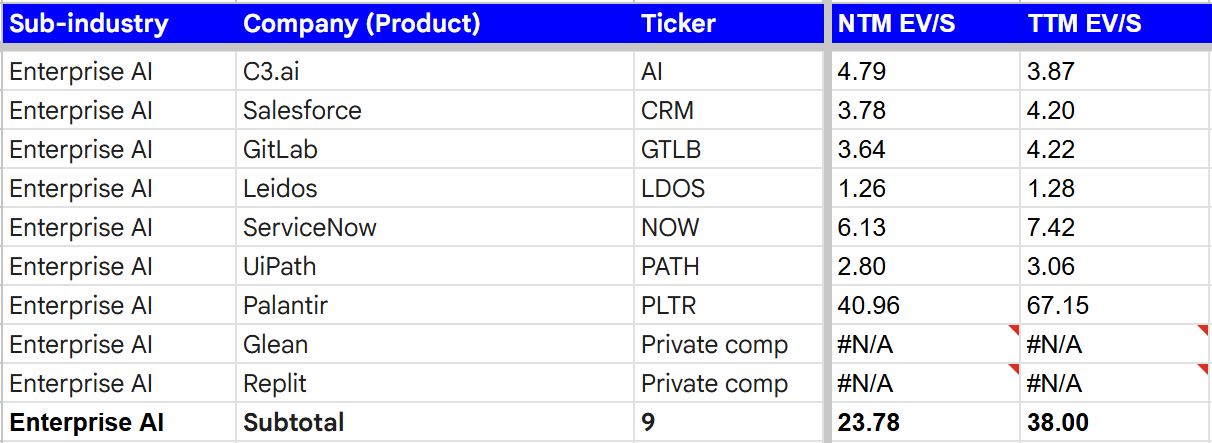
Enterprise AI software. Unlike consumer and prosumer tools above, this category is all about software built for corporations and governments. Tickers:
Now we have 77 companies (65 public and 12 private) on our watchlist across 11 sub-industries. Let's look at how underpriced they actually are - in other words, their upside potential.
AI stocks: upside estimates
We can evaluate 65 of our 77 companies - specifically the ones that are publicly traded and file regular financial reports. To calculate upside potential, we look at three years of quarterly statements, consensus revenue projections from major investment banks (like Morgan Stanley, Citigroup, and JPMorgan), and daily stock prices. Our core assumption is simple: a stock price reflects the market's estimate of future cash flows left over for shareholders. We can express this with a standard formula:
We can rewrite this as a valuation multiple:
Then replace FCFE with revenue and margin:
For fast-growing companies, margin numbers can be noisy. That’s why we swap the P/FCFE multiple for EV/Sales:
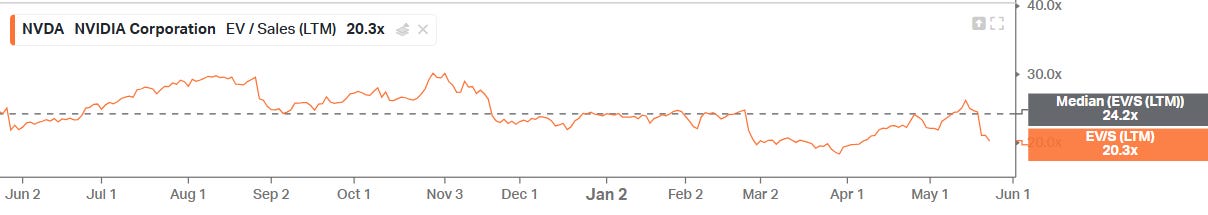
This ratio is usually stationary1 (meaning it tends to fluctuate within predictable boundaries), making it a reliable anchor for estimating fair value. As you can see below, Nvidia’s EV/Sales multiple generally trades right around its 1-year median:
Our upside metric is equal to the gap between a stock's current EV/S multiple and its historical median:
Right now, only 25 out of 65 public companies show a positive upside. But here is the trick: if a company's revenue grows while its stock price stays flat, its multiple drops. That widens the gap and increases the upside. Once we factor in future revenue projections, the number of underpriced stocks jumps from 25 to 46.
Among the underpriced (positive upside):
NVDA
CRWV
MSFT
Among the overpriced (negative upside):
ASML
TSMC
DOCN
Apparently, we won't make an investment based on this metric alone. It’s just a screener to help us see the big picture and figure out which companies are worth digging into.
The full breakdown of AI stocks by sub-industry is below. The actual upside estimates and underlying math are reserved for our paid subscribers. Let us know in the chat if you want this sent over as an Excel or Google Sheets file!